Showing posts with label stats. Show all posts

Smart Notes and Links 8/13/2009

1. Advanced NFL Stats weighs in on the evaluating running backs/running games discussion, which I addressed (with assistance from some wonderful comments) here and here. Do read the whole thing, but Brian has, as always, a very interesting take. Drawing on earlier discussion about risky and conservative strategies for underdogs and favorites (see my discussion of the topic here and Brian's here), he asserts:

I want to address an age-old water cooler question that Chris discussed in his post at Smart Football. Consider two RBs, both with identical YPC averages. One however, is a boom and bust guy, like Barry Sanders, and the other is a steady plodder like Jerome Bettis. Which kind of RB would you rather have on your team?

The answer is it depends. Essentially, we have a choice between a high-variance RB and a low-variance RB. When a team is an underdog team, it wants high-variance intermediate outcomes to maximize its chances of winning. And when a team is a favorite, it wants low-variance outcomes. Whether those outcomes occur through play selection, through 4th down doctrine, or through RB style, isn't important. If you're an otherwise below-average team, you'd want the boom and bust style RB. If you're an otherwise above-average team, you'd want the steady plodder. . . .

Further, even if the high-variance RB has a lower average YPC, we'd still want him carrying the ball when we're losing. This is due to the math involved in competing probability distributions.


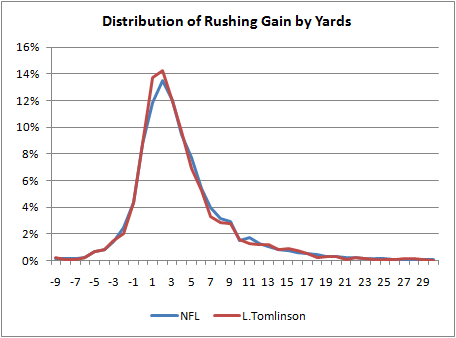
That's just one aspect of it. He uses a handy chart for the distribution of runs for the various backs...


...and notes how curious it is that Tomlinson's distribution looks so much like that of the rest of the NFL. (This same thing ends up holding true for most backs.) What conclusions does Burke draw? With the usual caveats,

[w]hat amazes me is how similar they all are to each other and to the league average. . . . Usually, a RB needs 4 to 5 yards to just break even in terms of his team's probability of converting a first down. What we'd want to see on a RB's distribution is as much probability mass as possible to the right of 4 yards.

So if [Jerome] Bettis' distribution looks so much like Tomlinson's, how does Bettis have a 3.9 career YPC and Tomlinson have a 4.4 career YPC? As others have noted previously, the difference among RB YPC numbers primarily come from big runs. It's the open field breakaway ability that separates the guys with big YPC stats from the other RBs. Of Tomlinson's runs, 1.5% were for 30 yards or more. Bettis' 30+ yd gains comprised only 0.46% of his carries. The other RBs and the league average are as follows:

- NFL 0.91%
- [Jamal] Lewis 0.88%
- [Brian] Westbrook 0.93%
- [Adrian] Peterson 2.20%

Adrian Peterson's 2.2% figure is exceptional. It's interesting because it really suggests that what separates Peterson as a great runner is based on only 2% or so of his runs. Otherwise, he's practically average.


2. Courtesy of Brophy, I have added video of Mike Leach's "settle & noose" drill, which, it will be recalled, is both a great warm-up drill and works on teaching receivers to find holes in the zone and quarterbacks how to deliver the ball to them.


3. Tom Brady muses on life with Bill Belichick. As he tells Details:

"You'll practice on a Wednesday, and you'll come in Thursday morning and he'll have the film up there from practice," Brady says. "Sometimes, during practice, you throw a bad ball—that's the way it goes. But the video comes up and he says, 'Brady, you can't complete a g--damn hitch.' And I'll be sitting there thinking, I'm a [expletive] nine-year veteran, I've won three ---damn Super Bowls — he can kiss my... That's what you're thinking on the inside. But on the outside I'm thinking, You know what? I'm glad he's saying that. I'm glad that's what he's expecting, you know? Because that's what I should be expecting. That's what his style is."


(Ht Shutdown Corner).

4. Bruce Feldman chats with Norm Chow, who materializes into matter from various spectral rays to participate.

5. The NY Times's The Quad Blog chats with Dan Shanoff about, what else, his Tim Teblow blog.

6. Spencer Hall/Orson Swindle to SB Nation. When you get $7 million from Comcast, you better find ways to spend it, and I can't think of a better way than for SBNation (whose official name is "Sportsblogs, Inc.") to lure Every Day Should Be Saturday's Spencer Hall over, including away from the Sporting News. I like everyone else think this is a wise move for both sides, but one underrated aspect is that Mr. Hall/Swindle (Mr. Hall-Swindle? I kind of like that) will be able to focus on just one blog (and probably a book too), which should really let him flourish.

7. Holly over at Dr Saturday remembers Northwestern's magical 1995 season, which is still the only 10 win season in school history. This was a sort of epoch-changing season for NW -- though that is a very relative statement -- in that the Wildcats' history since has been considerably better. Indeed, two years later I saw them play in the Citrus Bowl against Tennessee (this was back in the "You can't spell Citrus without UT" days). Though, most of that game was spent marveling at the show Peyton Manning put on (408 yards, 4 touchdowns, no interceptions) as I sat there telling everyone around me what Peyton Manning's audibles would be (for some reason Northwestern thought it could play man coverage against Tennessee's receivers, so he kept checking to fades and slants). In any event, it is hard to overstate how strange but wonderful that 1995 season was for Northwestern. In football, sometimes the gods are with you.

More on evaluating the run game

The discussion surrounding evaluating the run game was great. I will have more to add, but I wanted to highlight some of the best commentary. First, I did want to say that my focus was generally on two aspects, and I don't think I made that clear.

One, I really am more interested in running games, or a team's ability to run, than I am in one runningback versus another. I definitely play fantasy football myself, but it's not the reason I get interested in football stats. Instead I want to know how good an offense is, and then secondarily how good a particular play is; whether Barry Sanders or Emmitt Smith is better is usually not a discussion I get into. As a result I don't mind so much that it's hard to disassociate how good a runningback is from how good the line is, or the faking, etc. From an evaluation perspective, if you can analyze one play being better than another, then you can pretty easily ask if it is scheme or execution, and thus concepts or players.

Second, I do prefer to focus on easily observable stats. Some of this is maybe my laziness, but that's one big appeal of yards per carry: I know it has little application on third down. (One yard could be a success if it converts for a first down, and eight yards could be a failure if it was third and ten -- but then what if the draw was a good call rather than an interception or a sack? I digress.) That is just mainly aimed at seemingly interesting stats that would be a practical nightmare, based on every play and then a subjective interpretation of how many guys he bounced off of or his vision and cutback versus contact, etc -- you get the idea.

Anyway, Bill Connelly of Football Outsiders (and RockMNation) had actually discussed this fairly recently:

Regular Varsity Numbers readers have probably become familiar with some of the basic VN concepts, namely PPP (Points Per Play) and the "+". PPP is a measure of explosiveness--the amount of Equivalent Points (EqPts) averaged per play. The "+" number compares an offense's output to the output expected against a given defense, and vice versa. With the "+" number, 100 is average, anything above 100 is good, and anything below 100 is bad.

Points Over Expected

Is there any way to use these concepts to come up with a good rushing measure? Of course! Meet POE (Points Over Expected), the collegiate stepchild of DYAR. Whereas a rusher's PPP+ would compare his EqPts output to what would be expected, and is therefore great for measuring an offense's overall effectiveness, POE is cumulative. It is a comparison of a rusher's total EqPts to the Expected EqPt total, subtracting the latter from the former.

POE = EqPts - Expected EqPts. . . .

Most Varsity Numbers measures, in one way or another, bounce output versus expected output. POE, a brother to PPP and cousin to S&P and S&P+, does just that. POE, which intends to both evaluate both per-play and cumulative success, could also be used to evaluate receivers and tight ends, but that will be hard without good "pass intended for _____" data (some college play-by-plays record detailed information in this regard, others do not). Right now, it is an RB-only figure, but it is a pretty good one.


Not sure I entirely buy this as the best method (requires getting into the nitty gritty of FO's methods), but overall this is a good starting spot. It tends to reward the explosive players.

Moving to the comments, a few highlights, though all were excellent. Brad said:

I don't think getting long runs is the only way a back can improve his average. He can also do so by getting less short gains.

Think of a back that gets 3 yds minimum on slightly over half of his carries and gets 6 yds on the rest. Then compare him to a back that gets loses a yard on a third of his carries gets 3 yards on a third of his carries and gains 10 yards on a third of his carries.

Both backs have a median rush of 3 yds, but the first back averages around 5 yds per carry while the second one averages only 4. However the second back clearly has more "Big play potential" because he gains 10 yards on 1/3 of his runs.

My point is that a back can improve his average vs median both by getting more long gains OR by having less short runs. Which of these two things that great backs do is a question for the data.


I should have conceptualized this better in the first place, because this helps explain why Reggie Bush has been such a mediocre rusher in the NFL. It's not his explosiveness (though he hasn't broken many very long runs), but his routine bad plays. It also is why Emmitt Smith and Barry Sanders are so hard to compare: Barry's stat line was full of negative plays and small gains, but checkered with the spectacular long runs. Emmitt Smith, the opposite. (And I don't think with Barry it was all just jump and bad blocking; it was also just his running style. Do you think he would have fit in well with the Denver Broncos "one-cut-and-go" philosophy? People say "oh, if he had played for them he would have had 3,000 yards but I'm not so sure.)

Tom points me to another good bit from Football Outsiders, this time by Mike Tanier, quoted at length:


The 4.0-4.1 yard average is an arithmetic mean: add up all the yards, divide by the attempts. The arithmetic mean is easily skewed by extremes in data. A 75-yard run can increase a starting running back's rushing average by several tenths of a point by the end of a season. This skewing always increases rushing averages: there are several 50+ yard rushes every year, but no 50+ yard losses on running plays.

We all know that a few big plays can make a mediocre running back's rushing average look great. But how much effect do long gains have on the league rushing average? The best way to see this is to break down every running play by distance. . . . The table reveals a surprising fact: the mean carry may yield four yards, but the median carry yields only three yards, and the data distribution is centered at two yards. . . .

Over 20 percent of running plays gain zero or one yards. Factor in losses, and over one-fourth of all runs result in negative or negligible yardage. The rushing average for the plays in the -4-to-10 yard range in 2005 was 2.95 yards per attempt. Long runs make up only about nine percent of all rushing plays, but they increase the league rushing average by over 40 percent. . . .

As a way of negating the importance of team strength as well as studying the contrasts between rushing styles, let's examine a pair of teammates from 2005.

Last season, Tatum Bell gained 920 yards and averaged 5.3 yards per carry. Mike Anderson gained 1,014 yards but averaged just 4.2 yards per carry. Despite the wide disparity in yards per carry, DVOA and DPAR ranked Anderson as the better back. Anderson was 37.0 points above replacement level, Bell 16.4. Anderson was 20.3 percent better than the average back, Bell just 7.6 percent.

Bell's rushing average was inflated by several long runs: he had a 68, 67, and 55 yard run in 2005, plus several 35-yard runs. Anderson's longest carry of the season was 44 yards, and that was his only run longer than 25 yards. We all know that Bell is a "home run threat" while Anderson is more consistent. But is it really fair to downgrade Bell because of his long runs? We're inclined to downgrade Bell somewhat because so much of his value is contained in a few plays. But is that really fair? After all, gaining four yards at a time is great and all, but big plays are pretty important, too. . . .

Anderson's yardage distribution is centered in the 2-3 yard range, while Bell's is centered in the 1-2 yard range, giving Anderson a full yard-per-play advantage on carry after carry. Bell's advantage, of course, is on runs of more than 10 yards. All but 6.5 percent of Anderson's runs gain from -4 to 10 yards, while 10.5 percent of Bell's runs are outside the chart (he only lost five yards on one play last season). Give them both 200 carries, and Bell will have eight more long runs than Anderson, and those runs will be longer than what Anderson can usually muster. But Anderson will gain an extra yard that Bell couldn't on dozens of other
runs. . . .

Anderson's in-the-box mean was 3.36 yards per attempt, noting again that his "box" is larger. Bell's was just 2.67. What's interesting is that we tend to think of backs like Anderson as "ordinary" while backs with Bell's big-play potential are held in higher esteem. But Bell's rushing distribution is more in line with the league norms than Anderson's. He's very good, but his contributions are typical of what backs around the league provide. Anderson, at least in 2005, was the unique player, providing hard-to-get, down-in, down-out production.

The difference between Bell and Anderson suggests that "cloud of dust" backs are more valuable than "boom or bust" backs, but we must be careful when using cheesy labels. Our perception of a back's production profile are often way off. How would you classify Marshall Faulk in his prime? Probably as a boom-or-bust back, albeit one with lots of boom and only a little bust.

But Faulk's running distributions show that in his prime he was much more than a big-play machine. . . .

Faulk's in-the-box mean was 3.37, a very good figure. What's more, his "box" only included 86 percent of his runs. Faulk had seven 12-yard runs, six 16-yard runs, and three 18-yard runs in 2000, giving him a very high percentage of 11-20 yard runs. But what's most remarkable about his production was his ability to avoid no-gainers and his above-average totals in the 3-5 yard range. Fast, shifty Faulk was just as good at using his skills to gain a yard or two as he was at burning defenses for long gains.

By contrast, [Jonathan] Stewart's ability to avoid losses and pick up two or three yards couldn't offset his complete lack of big-play potential. At first glance, Stewart's distribution looks similar to Anderson's. But his in-the-box mean of 2.8 is over a half-yard lower. The differences are subtle -- Anderson is a little more likely to gain five or six yards and a little less likely to lose yardage -- but they add up over a few hundred carries. And Stewart, like Anderson, concentrated 95 percent of his carries in the -4-to-10 yard range, so he had few 10-20 yard bursts to increase his productivity. Stewart, like Anderson, was providing a unique skill, which is why he was able to stay in the league for several years. Unlike Anderson, he wasn't a great exemplar of that skill, and the Football Outsiders metrics took him to task for it. . . .

Teams don't generate rushing yards in three-, four-, or five-yard bursts. They gain it through punctuated equilibrium, waiting through dozens of minimal gains for a few big plays per game.

And those big plays aren't that big. We've focused on gains of ten or less in this article, ignoring the 10.5 percent or so of plays that yield more yardage. The vast majority of those runs gain 11-20 yards: 6.9 percent overall. Almost 25 percent of the rushing yardage gained in the NFL is generated on runs of 11-20 yards. There were 960 such runs last year: 30 per team, or just over two per team per game. Amazingly nearly 10 percent of all rushing yardage is generated on runs of 30 or more yards, plays which occur about four times per year for a typical team.

These distribution breakdowns are so interesting that they might seduce us into making some wacky conclusions. Keep in mind that all of these averages and distribution patterns are situation dependent. . . .

Without further study, we shouldn't leap to grand conclusions. But we know this much: if we expect to gain four or five yards on every running play, we're going to be disappointed most of the time. No wonder passing totals have been creeping up for decades. If all a handoff gets you is two yards and a cloud of dust, you might as well throw the ball.


Lots going on here, but it mostly just reinforces what we know: Backs and teams have different styles, and it is not always easy to compare them; you want a guy who (a) does not lose yardage, (b) consistently gets positive yardage, and (c) is a big-play threat. They don't always come that way, so it is interesting that Tanier and FO conclude that the consistent back is simply better than the big-play threat. I'd like to see more to support that -- i.e. that the "dozens of first downs" or extra yards Anderson might have pulled down for the team were worth more than Tatum Bell's big plays. I'm not saying I disagree, but that it is interesting. That kind of conclusion could have troubling implications for a guy like, say, Barry Sanders, or moreso Reggie Bush.

Chase of the PFR Blog points out marginal yards, and adds:

I looked at rushing yards over 3.0 yards per carry. However, as the author has implied, I've begun shifting my focus away from yards per carry.

Rushing first downs is a key part of evaluating a running game. Without play by play information, I'd want to focus on rushing first downs, rushing yards, rushing TDs and carries.


I think this is good; rushing first downs should be part of the evaluation. According to CFBStats, last season's top first-down teams in college football are an expected bunch:

1. Air Force
2. Tulsa
3. Navy
4. Nevada (tie)
4. Oklahoma State (tie)
6. Oregon
7. TCU
8. Florida
9. Oklahoma
10. Georgia Tech

As a side note, I do think yards per carry is most useful on first down, and CFB Stats (as well as the pro-football reference site), has a ready breakdown of rushing stats by down, for all teams. For example, the yards per carry of the top 5 teams in the country last year, limited solely to first down, were:

1. Nevada 6.95
2. Louisiana-Lafayette 6.77
3. Florida 6.76
4. Navy 1843 6.12
5. Oregon 1676 5.96

Each team had over 1,600 yards on first down alone (everyone bud Oregon had over 1,800, and Nevada over 2,000). And those averages -- yes I just pasted that thing from FO saying you can't solely look at averages -- indicates that these teams had a lot of favorable down and distances to convert (Louisiana-Lafayette, the one seemingly strange entry, was in the top 15 of total offense last year despite not being a great throwing team).

In the end ... I have to think about this question some more. I think we're moving in the right direction, as, again, part of my motivation is to find handy and easy to use stats (thus one reason I dislike the idea of some kind of "running back efficiency rating" like they use with quarterbacks). I agree that the debate is going to be between styles of running game (or running back), as well as situation. I would imagine that teams like Oregon or Georgia Tech are going to have much different looking rushing distributions than, say, Wisconsin. But we're on our way down the path to the end.

End note: I'll be on vacation this week. I have a couple of posts set to go up, but otherwise I'll be out of pocket until next weekend/week. Cheers.

Responses to responses about David and Goliath Strategies

Tomahawk Nation responds to my earlier post on David & Goliath Strategies. See parts one and two of TN's responses. (See also my post on conservative and risky strategies and kurtosis.) Both pieces are well worth the read (I am a supporter of anything that combines football and six sigma). But a couple basic thoughts:

First, I completely agree with the idea of reducing variation, particularly negative variation. That really is the genius of Bill Walsh's passing game: what he brought to the game was a reduction of risk related to passing. Passing had been the quintessential "underdog" or David strategy; he reduced risk so much it arguably stopped being a David strategy and became a dominant one.

But I'm not sure if I agree with this:

Think of UF. To me, the Urban Meyer offense at Utah is a prime example of a David strategy. As he moved to Florida, he helped a Goliath school with Goliath resources begin to think like a David. People said that his offense would never work in the SEC, the QB would get killed, defenses were too fast, etc. But Meyer knew that his approach took advantage of a weakness in defenses, and if executed properly wouldn't be nearly as risky as people thought. Think back to the Ole Miss game from 2 years ago (the game that might have won Tim Tebow the Heisman). When the basic structures of the Meyer offense failed to work against the Ole Miss defense (Goliath being unable to hit David with his sling), and Ole Miss still allowed UF to stay in the game (Goliath managing to fight to a draw with David in a slingshot battle), UF was able to run Tim Tebow left/Tim Tebow right to win the game (Goliath is able to fall back on his superior size and strength combination to win the battle). . . .

...Gladwell highlighted the press in basketball as an example of a David strategy. Why is this a David strategy? Because Goliath doesn't focus on beating the press as much as David focuses on executing it. Because it takes Goliath out of his comfort zone. And honestly, because frequently the top point guards in the country have a certain level of confidence/cockiness in themselves that makes them want to beat the press by themselves and not rely on their teammates. The goal of the press is also to force the ball into someone's hands who is not used to handling the ball-- an inefficiency in Goliath's approach. This is how a team can use the David strategy to capitalize on an advantage. It's a risk, but if executed correctly it's not just a risk for the sake of being risky.


But is that really a David, or underdog strategy? Or is it a dominant strategy? I.e. better no matter who you are? One of the reasons I wrote my post was that I thought Gladwell confuses this point too, and I also concede at the end of the post that one conceptual difficulty is that some strategies are better for favorites (Goliaths conservative, low variance strategies), some solely for underdogs (risky David strategies), but some strategies are simply better no matter who you are (dominant), or inferior (punting on first down).

The things Tomahawk Nation is focusing on are, to me at least, dominant: better matchups, an unusual strategy the favorite is not ready for, etc. Admittedly, Gladwell confuses these two concepts -- or at least doesn't tease them out -- but I do think it's important.

To better illustrate what I mean, Advanced NFL stats showed that David strategies are often beneficial for underdogs even when they are basically inferior overall. In other words, even if a strategy would result in fewer expected points, it still would benefit the underdog because it still could get lucky. As ANFL explains:

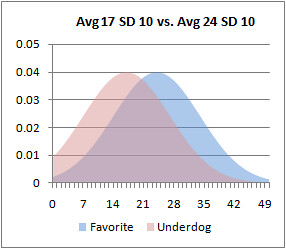
Here’s why underdogs should play aggressive and risky gameplans. Take an example where one team is a 7-point favorite over its underdog opponent. Say the favorite would average 24 points and the underdog would average 17 points. With a SD of 10 points for each team, the underdog upsets the favorite 31.5% of the time. The favorite’s scoring distribution is blue and the underdog’s is red.


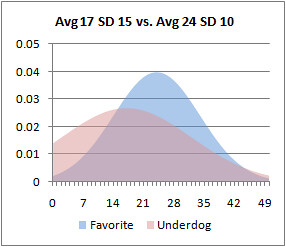
But if the underdog plays a more aggressive high-variance strategy, increasing its SD to 15 points, it would upset the favorite 35.3% of the time.


Note that I haven’t increased the underdog’s average score in any way, just its variance. The increase in its chance of winning results due to more of its probability mass moving to the right of the favorite’s mean score of 24. In fact, the higher the variance, the wider the probability mass will be spread. Consequently, more mass will be to right side of the favorite’s average score. But more mass will also be to the left, meaning there is a higher risk of an embarrassing blowout.

Even if employing a high-variance strategy is non-optimum, it can still help an underdog. In other words, even if an aggressive gameplan results in an overall reduction in average points scored, it often still results in a better chance of winning.


Yet would there be any reason for a Goliath to use this strategy? No, not at all. All it would be doing is inviting variance that would result in a few more upsets, and in fact might make the team worse (though could give the illusion of success because, again, of its high variance, resulting in a few high-scoring output games).

This is the biggest problem with the example TN uses:

Goliath University believes in the old Big Ten philosophy, 3 yards and a cloud of dust. Let's say they've even perfected their approach to the point that they can get exactly 3.3333 yards every time without ever turning the ball over. There is no risk involved and they know exactly what they are going to get with every play. Per play, they expect to get around .23 points. In true Goliath fashion, however, they run a quick, no-huddle offense in order to maximize the number of trials on the field. Over the course of the game this translates (assuming about 100 plays per game) to about 23 points and let's say a little over 30 minutes T.O.P. They'd win most of their games, but they'd lose any game where their defense gave up 24 or more due to random variation in the amount of time their opponent held the ball.

Goliath State University instead takes a more wide open approach, similar to Tulsa's offense. They throw the ball a lot more often, and go downfield more frequently as well. There is a lot more uncertainty associated with this approach, as there are many possible outcomes to their plays. However, through the strength of their preparation, they have a 50% chance of completing any given pass. Each of their 5 options (4 receivers and a QB run) has a 10% chance of success.

* If the QB runs, there is a 70% chance he will gain 4 yards, a 25% chance he will gain 14, and a 5% chance he scores
* Receiver A is running our deep fly, and there is a 50% chance he gets a 40 yard completion and a 50% chance he scores
* Receiver B is running the post, and there is a 80% chance he will get a 14 yard completion and a 20% chance he scores
* Receiver C is running the out, there is a 95% chance he gets 7 yards and a 5% chance he scores
* Receiver D is running the drag, there is a 95% chance he gets 4 yards and a 5% chance he scores

The expected point value of this play is:

.5*.1*((.7*.23+.25*1+.05*7)+(.5*3+.5*7)+(.8*1+.2*7)+(.95*.5+.05*7)+(.95*.23+.05*7)) = .468 expected points per play


Again, this is simply a better strategy, which is different than being a David strategy. Risk does not automatically equal David, and very conservative does not equal Goliath. Sometimes there is still better or worse.

To be fair, there is some indication in the TN pieces that this comes through. It repeatedly discusses the need to reduce the riskiness of these strategies "through film study, personnel decisions, and practice." Again though, I would argue that (a) these extra resources are themselves often a Goliath strategy (this becomes evident at high school for sure, but also in college with big differentials in resources, film equipment, practice materials, etc), and (b) practice and preparation is the quintessential dominant strategy -- it neither favors the underdog nor favorite, it's just a good idea!

The upshot is that these are two very good pieces, and well worth the read. I just want to emphasize my earlier point that I am using David and Goliath strategies in a very specific way, and one that differs slightly from Gladwell (it may not even be correct, it's just how I am using it). A true "David strategy" is one that, by definition, would not be good for a Goliath, because it is riskier. I used the example of extra fake punts, onside kicks, going for it on fourth, trick plays, etc. Relatedly, some Goliath strategies are low variance but that doesn't mean they have to be literally three-yards and a cloud of dust.

But the important point that TN clearly does get is that, Goliaths may nevertheless act suboptimally, and it is the underdogs and Davids that might discover the better, dominant strategies. The dominant ones will be adopted by those Goliaths (think of the spread of the spread, with its ability to push boundaries while keeping risk low), and others, though derided mightily as "gimmicks," simply might be appropriate for an underdog. It's not always easy to tell the difference, but this is an idea definitely worth continued exploration.

What makes a good running back? How do you evaluate how good a team's run game is?

The pro-football reference blog recently mentioned something I found fascinating:

What about rushing? . . . .In modern times, most RBs have a median carry length of three yards. I suspect that’s been the case for the majority of RBs for a long time. LenDale White and his 3.9 YPC last season? Median rush of 3 yards. Adrian Peterson and his 4.8 YPC? Median rush of 3 yards.


I think this has powerful implications. If most runningbacks tend to have the same median rush, then those who are more effective -- and hence have higher averages -- would be almost exclusively based on their big-play ability. (That big-play ability could still come in different forms, i.e. the guy who consistently can turn five yarders into 15 yarders, or the guy who can break every 10th or 15th rush into a 50 yarder.)

But this would imply that the powerback, or at least the powerback who is not considered so explosive, is overrated. (Earl Campbell could run you over and break off big gains.) The point is just that the premium would not be on the player's results on the average plays, but instead on the longer ones. Some of this too can be the surrounding cast. Indeed, as Homer Smith has said, a runningback who gets 130 yards on 20 carries plays in a better offense (either because of him or for whatever other reason) than a guy who gets 145 on 35 carries.

But this does all assume that average yards per carry is the most important stat. I'm not sure all would agree that it is. (In fact, I think the PFR Blog folks might not agree, as they ranked runningbacks and included their total carries and pure total yards as a key factor.) I'm not convinced that more carries means a better back or better running game, as that depends on the game situation (does the team get a lot of leads?) and also that the play-calling is optimal. I can also buy that on 3rd and 3, or third and goal, the point is to convert, not to help the average.

Yet then how else can we evaluate running backs, or even a running game more generally? A perusal of the best offenses and running games in college tends to show that the best all have high yards per carry; not too many BCS teams have averaged fewer than 4.5 yards per carry, and several have averaged well over five yards per rush attempt (including sacks, which count against the run game total in college).

So I'm opening the floor to better ideas. IF yards per attempt is the best metric (for either an individual back or a team's run game), and IF the median truly is right around 3 yards for great and average backs alike, then the difference between good and mediocre runningbacks and rushing teams would seem to be wholly in the explosiveness of the upper 50% of plays: a good team or player can rip off big gains, and turn big gains into touchdowns, while the average plays for both is about the same. (And maybe negative plays are overrated.)

But I'm interesting in everyone's thoughts on this question. How do you evaluate the running game?